Big Data together with mobility analytics and location intelligence techniques allow increasingly accurate estimates of the levels of visits received by points of sale, revealing geographic patterns of brand loyalty and market penetration.
Wednesday, October 6, 2021
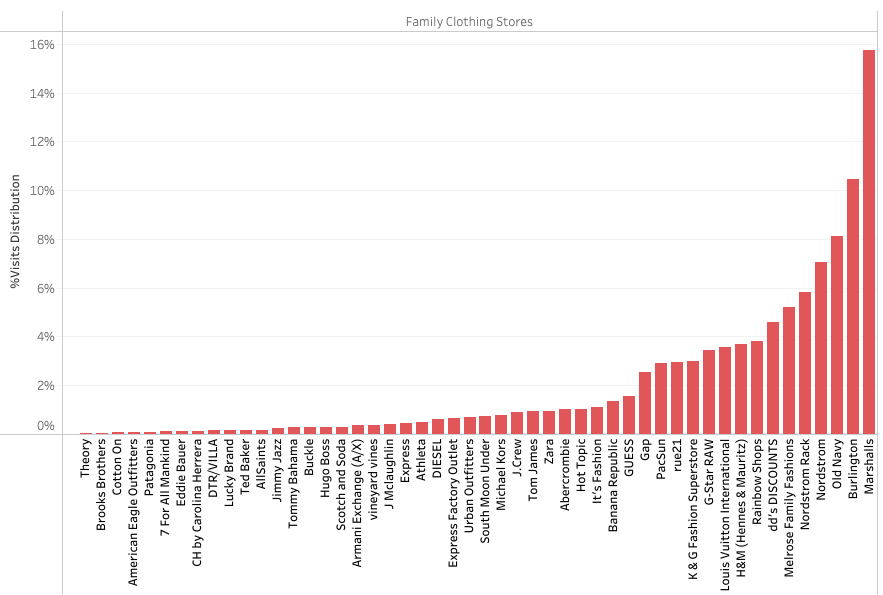
Get to know the competition and how they behave in the market is now possible, thanks to technological tools that provide an overview of mobile device activity associated with brand locations, helping to visualize a detailed picture of consumer engagement, brand loyalty, and market share.
These types of insights provide a high-level view of how brands compete in a broad geographic space, serving as the basis for marketing campaigns with a relatively wide reach, such as television commercials or nearby transportation.
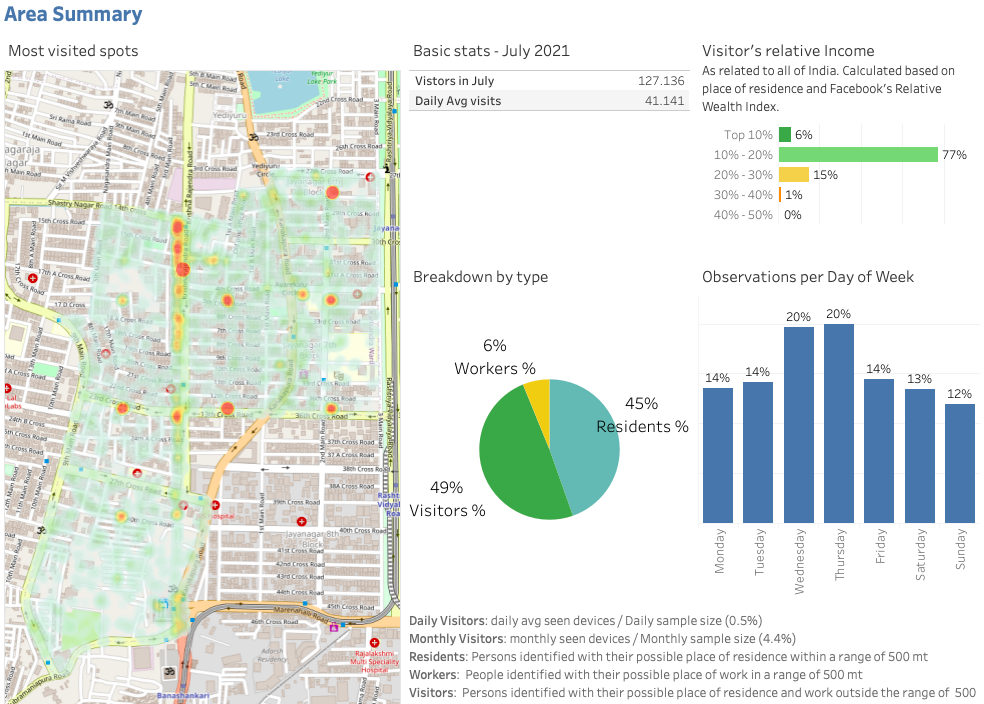
In order to obtain a more detailed picture, segmentation into zones or points of interest is performed. This generates indicators for businesses to increase advertising on local digital billboards or deploy attractive mobile offers for consumers in the area. Similarly, it is possible to identify which advertising techniques are working and apply them in other locations where it is possible to increase market share.
With an understanding of foot traffic for both their own and competitors' outlets, brands can accurately plan marketing campaigns and expansion strategies.
Foot traffic data can also be applied to expansion models, regionally, statewide, globally, etc.; by focusing on a specific area, brands can see if their competition has a much larger share of both foot traffic and market penetration.
Taking advantage of this information, retailers can decide where to open or close stores, opting to open more stores in the area to gain more market share or to consolidate stores and focus on a few key locations.
In order to identify specific areas on which to focus site selection efforts, we can get more details and show consumer trends. This analysis could inspire any business to open another location, or serve as a model for which markets to open or avoid when selecting future sites.
AtPREDIK Data-Driven we measure how foot traffic has changed over time can help brands identify the relationship between customer loyalty and geographic proximity or convenience, helping companies develop sound data-driven strategies to succeed in their business.
¿Busca soluciones de inteligencia comercial para su empresa?
Need to implement this analysis to secure the success of your business? Contact us!
Your message has been sent. We will contact you shortly.
Predictive location, and foot traffic analytics reveal valuable information that helps retailers to choose the right location when setting up geographic expansion strategies.
How are predictive analytics models used to determine the optimal location for a new facility?
Retailers are already implementing Big Data tools such as location intelligence and foot traffic analytics to understand consumer mobility patterns, measure foot traffic at each store, understand the performance of their outlets, and estimate competitor turnover.
Business intelligence and technology tools enable retail businesses to deeply analyze the behavior of their customers inside and outside their stores, in order to identify the ideal location for future expansion plans.
The data science models are the third phase of location and mobility intelligence analysis, helping retailers to assess the market potential of areas of interest for new store openings and identify optimal potential locations for expansion. These are divided into three steps:
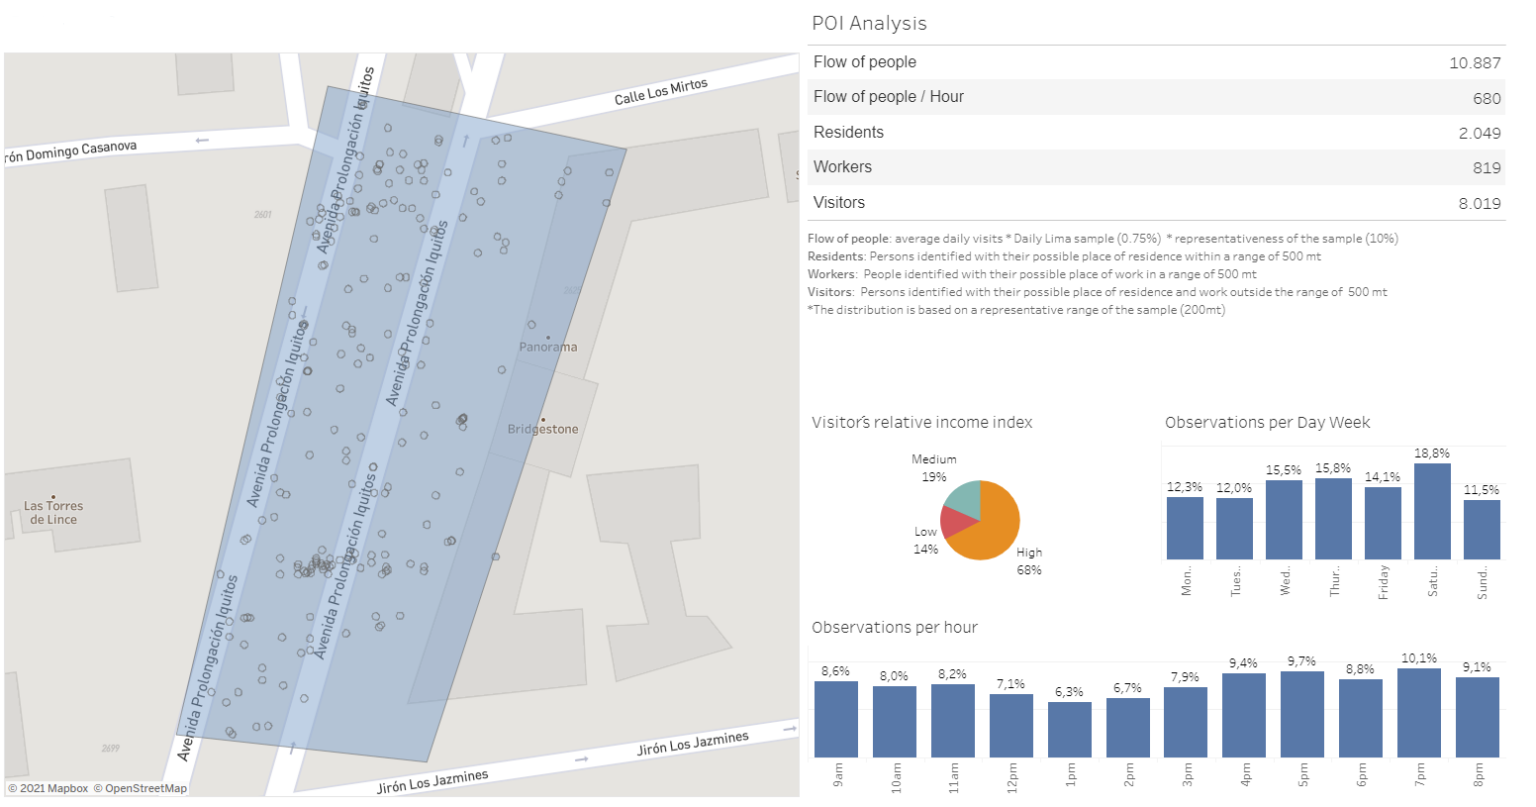
Location intelligence and mobility analytics allow companies to create Out-of-Home advertising strategies focused 100% on the tastes and preferences of the people who pass through each point.
In outdoor advertising (OOH), knowing in depth the consumers who pass through the point where the advertising will be exposed is crucial to maximizing as much as possible the return on investment.
×
ok
6931Government Procurement Opportunities in the region
 español


 6931
6931